Debugging Sitecore (and other 3rd Party) Binaries with Visual Studio and dotPeek
If you have been working with Sitecore and its corresponding API/Framework for some time, you are most likely already familiar with decompilation suites, such as dotPeek, JustDecompile, ILSpy and dnSpy. This blog post explains how to actually attach your Visual Studio Debugger to decompiled Sources.


If you have been working with Sitecore and its corresponding API/Framework for some time, you are most likely already familiar with decompilation suites, such as dotPeek, JustDecompile, ILSpy and dnSpy. Wouldn't it be great if you could not only decompile, but also step into these decompiled Sources and leverage native Visual Studio debugging functionalities at runtime, such as breakpoints and step-by-step debugging? Well, we got a solution for you - and we are going to take this to the next level by applying this to Sitecore Solutions running within Docker containers.
The Ingredients
In order to step into decompiled sources, we will mainly work with two tools: Visual Studio, which is going to be our debugging engine, and Jetbrains dotPeek, which will act as our Symbol Server. In order to get a nice decompilation integration into Visual Studio, we are also leveraging the Jetbrains ReSharper Visual Studio Extension.
In addition to the tools, you will also require the original Sitecore binaries. These can be downloaded from the official Sitecore releases pages. I usually download the Packages for XP Single package for On Premise Deployments and extract the Sitecore vv.v.v rev. rrrrr (OnPrem)_single.scwdp File, which contains all binaries in the Content/Website/bin directory. Please make sure that the binaries you are downloading match the Sitecore version which you want to debug.
Setting Up dotPeek
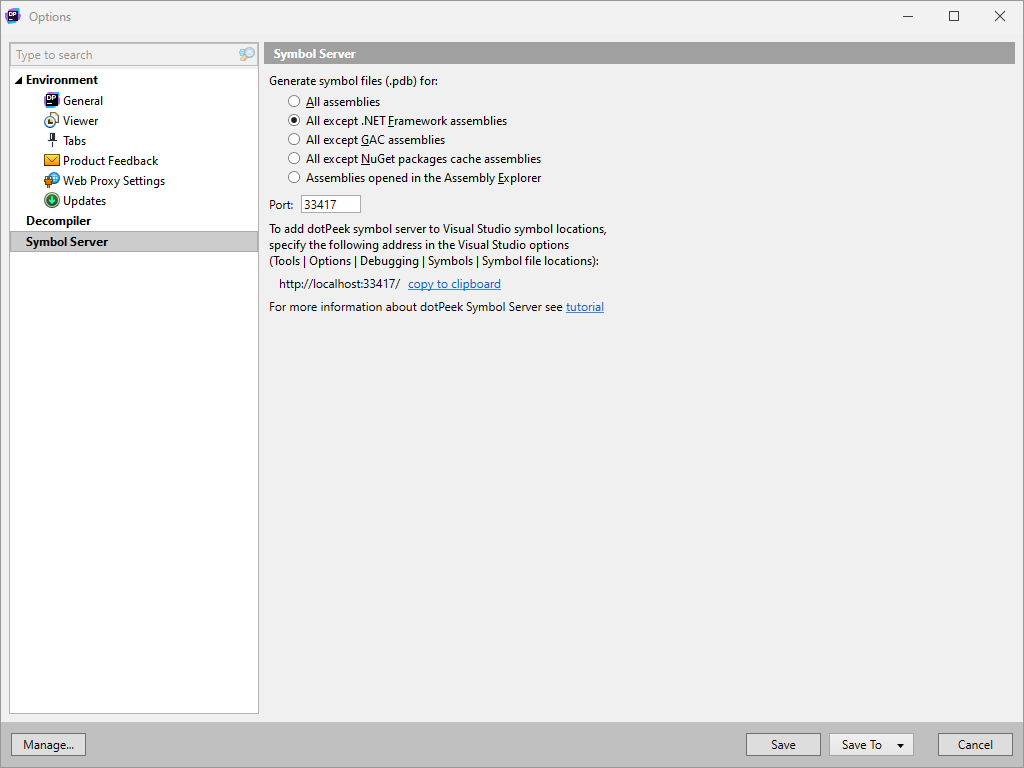
Once you've got dotPeek started, navigate to Tools --> Options... and select the Symbol Server node. Ensure that you have at least All except .NET Framework assemblies selected. Feel free to also change the Port setting, if the default generated Port is already in use on your machine. Copy the displayed address, as we will use this later.
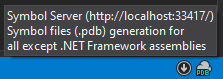
Once the configuration is in place, the Symbol Server can be started by selecting Tools --> Symbol Server. On the bottom right of the dotPeek Window, the Status Indicator should now confirm that the Symbol Server is indeed running.
In order to get a visual representation of all decompiled sources, you can go ahead and select Windows --> Pdb Generation Status, which will open a new window.
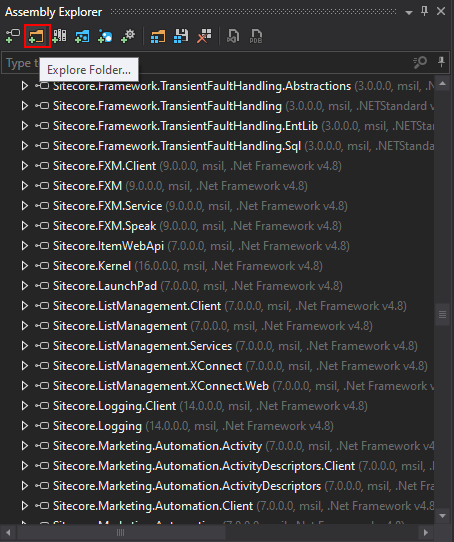
As a last step in dotPeek, we will need to add the Sitecore binaries. For this, select the Explore Folder... button within the Assembly Explorer window and navigate to the directory containing the Sitecore binaries you've downloaded as part of the prerequisites.
dotPeek is now ready to process our binaries and we can move on to Visual Studio.
Configuring Visual Studio
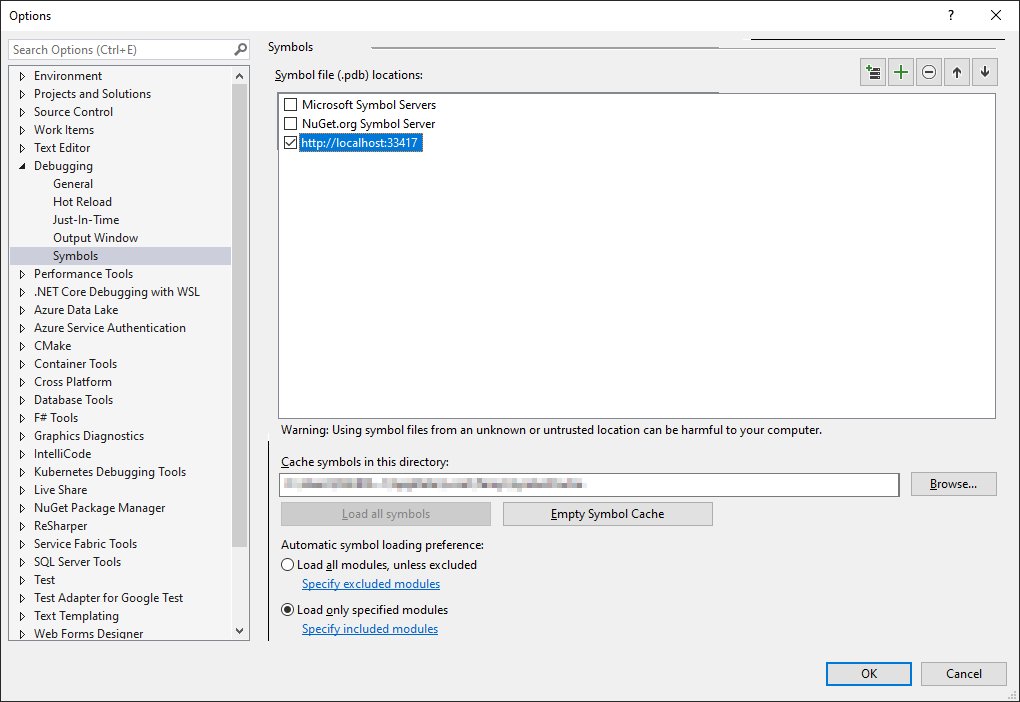
In Visual Studio, navigate to Tools --> Options... and select the Symbols node under Debugging. Here, you can now enter the dotPeek Address you've copied before in the Symbol file (.pdb) locations Section. Feel free to also change the Location where you want to have the Symbols cached. We also recommend to select Load only specified modules Option, in order to prevent sending all Binaries to dotPeek starting the debugging Process.
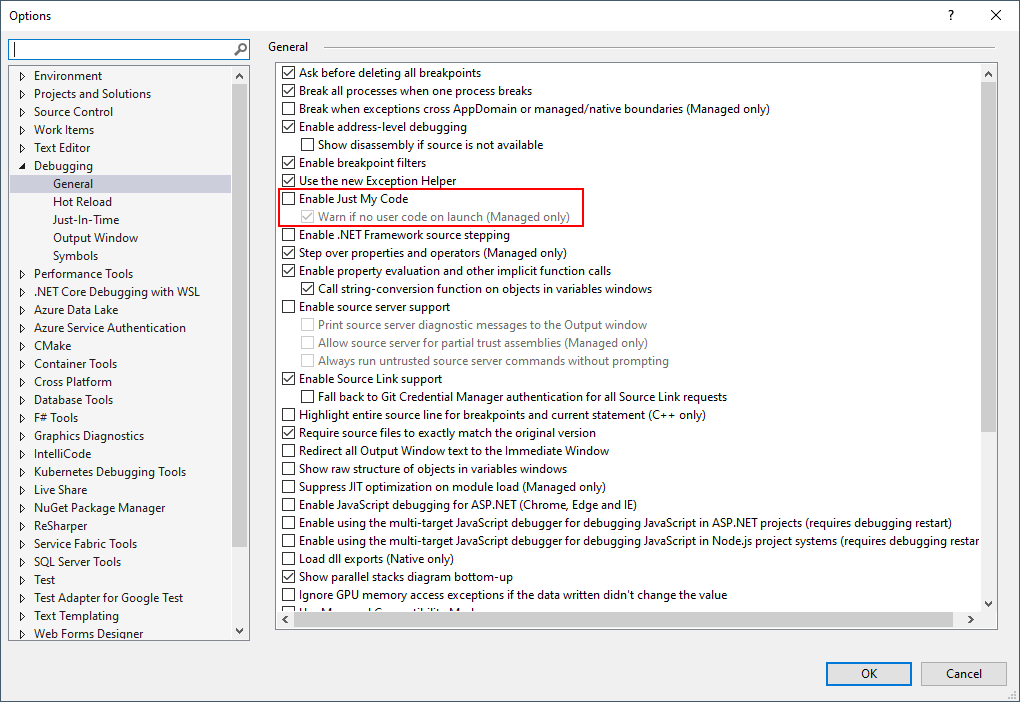
Next, select the General node under Debugging and ensure that Enable Just My Code is disabled.
At this point, we got both tools configured and are ready to start our debugging journey.
Connecting to a Running Sitecore Instance in Docker
In order to connect to Docker instances, the corresponding remote debugging tools need to be available on the running image. However, since these are part of the official Sitecore Docker base images, we are omitting the description on how to install them in this blog post.
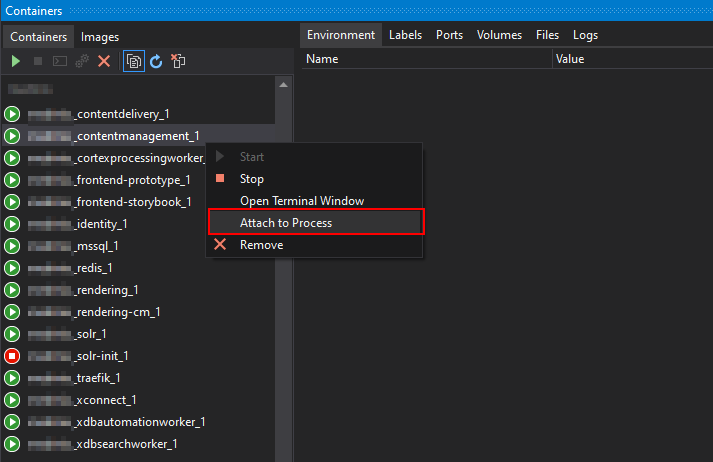
Once your containers are started, you can get an overview in the Containers window in Visual Studio, which can be toggled using View --> Other Windows --> Containers. In order to connect the debugger, right-click on the corresponding container you want to debug and select Attach to Process
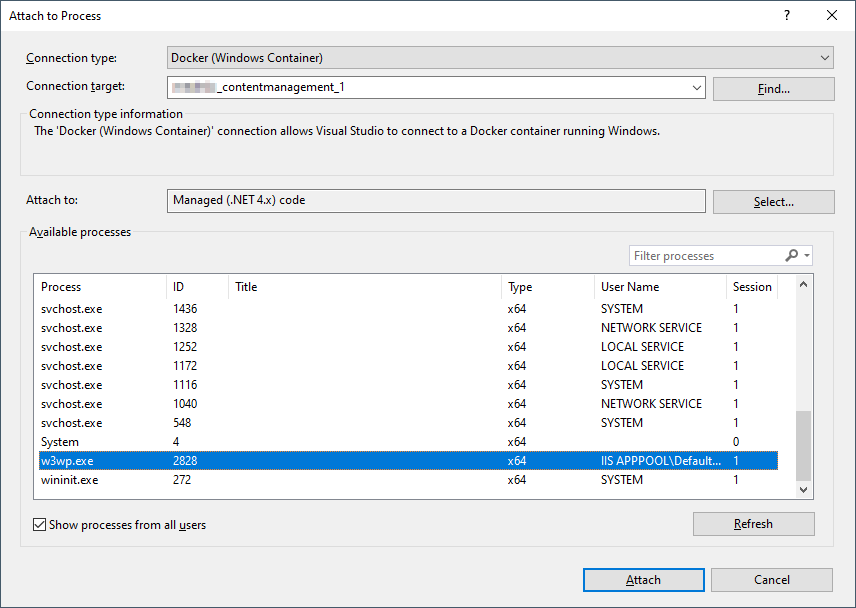
This will trigger a new popup window. Ensure that the following settings are selected:
- Connection type:
Docker (Windows Container) - Attach to:
Managed (.NET 4.x) code Show processes from all usersneeds to be activated
This should now allow you to select the corresponding IIS worker process (w3wp.exe). Once all of this is configured, click Attach.
Setting Breakpoints and Loading the Modules
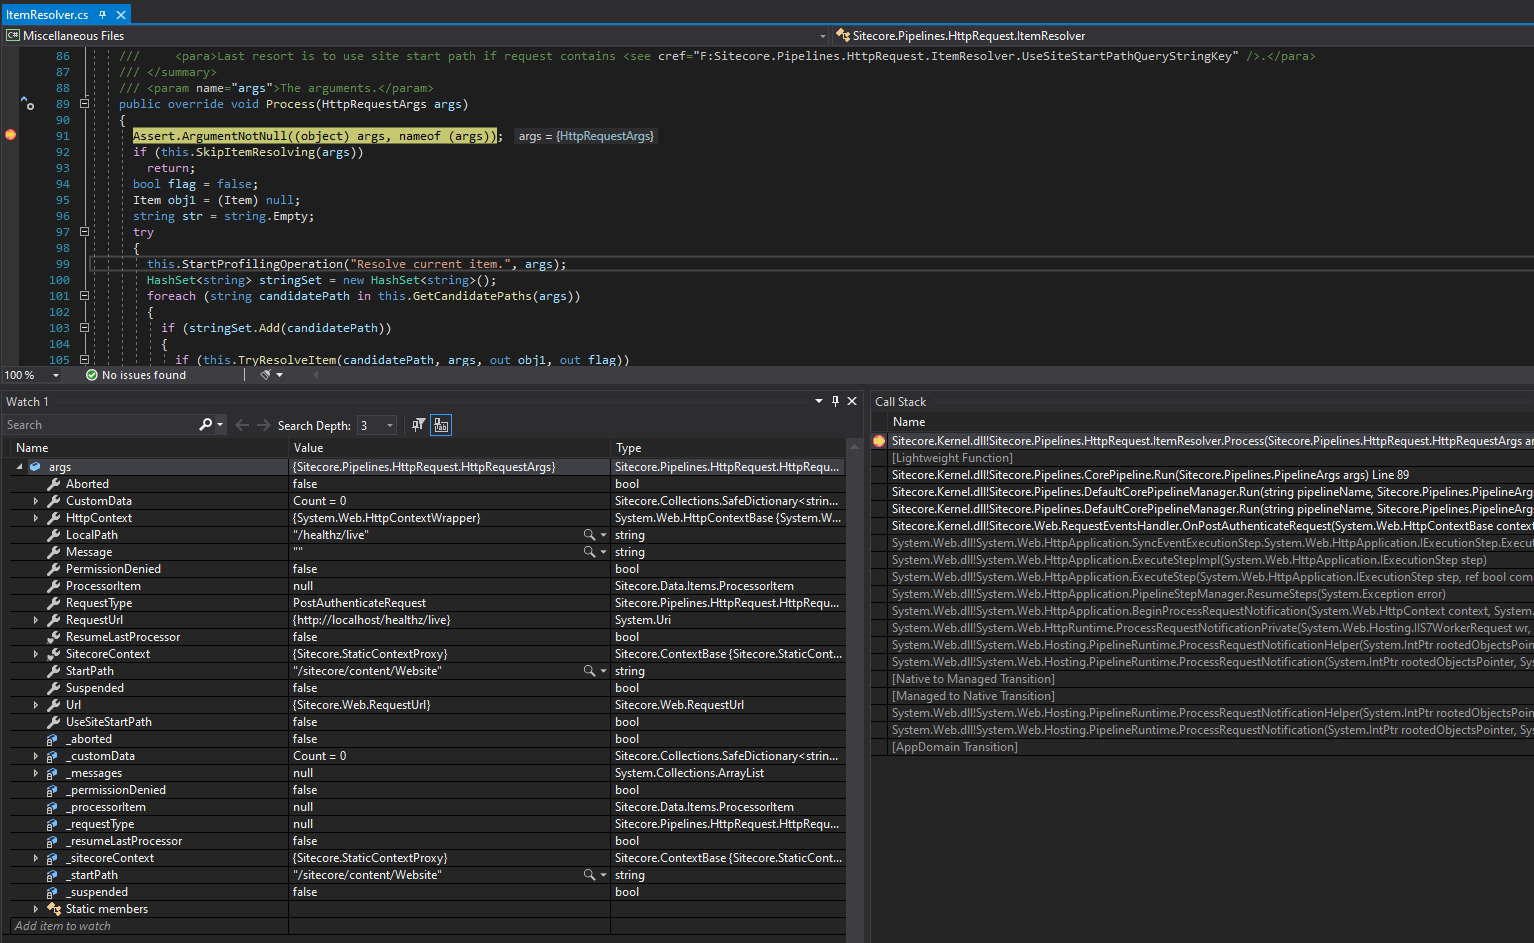
You can now proceed and instruct Visual Studio / ReSharper to decompile any class that is used by your Solution, for example ItemResolver (using the CTRL+T shortcut by default) and set your breakpoints as needed.
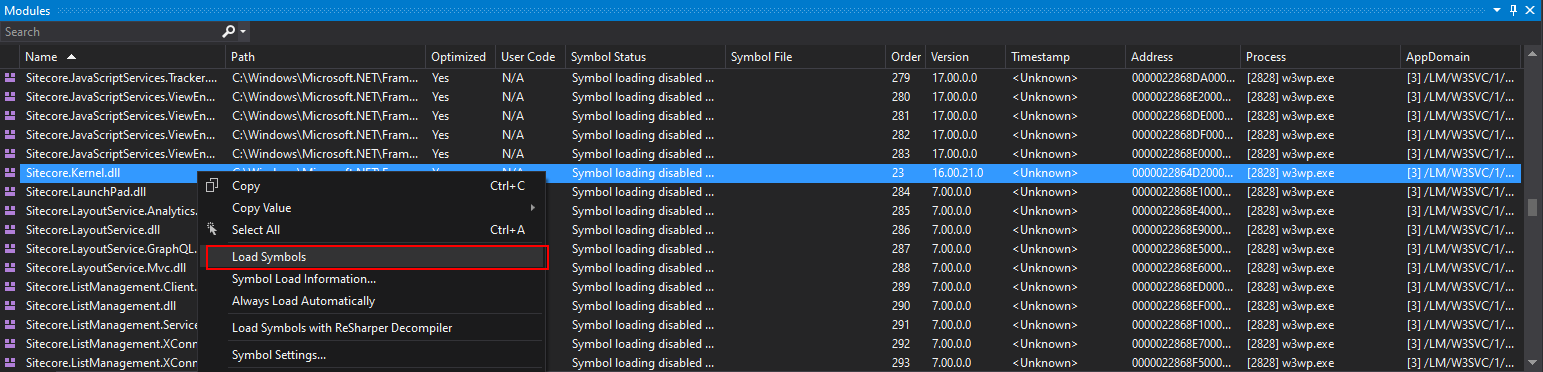
The final step is to instruct Visual Studio to make the request to our Symbol Server. For this, open the Debug --> Windows --> Modules window in Visual Studio (note that VS must to be attached to the process to have the selection available). This will show you a list of all loaded binaries within the IIS worker process. Go ahead and right-click the binary for which you have added your breakpoints for. In our example, we are going to load Sitecore.Kernel.dll. In the context menu you want to select Load Symbols.
You will notice three things happening:
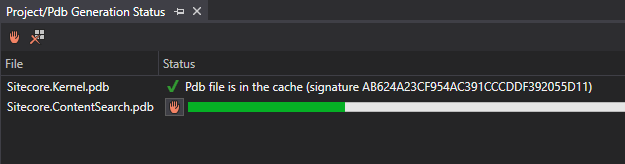
- dotPeek will display the selected assembly and the Pdb generation progress in the
Project/Pdb Generation Statuswindow. - Once the Pdbs have been generated, the breakpoints will turn active.
- Visual Studio will break on the set breakpoints, once the code is executed.
Please note that if you always want to automatically load a set of specified assemblies, you can select the Always Load Automatically Option in the previous Context Menu.
Final Remarks
Due to the fact that all provided binaries by Sitecore are compiled against Release targets, the assemblies are optimized. Therefore, you might notice that certain lines do not accept breakpoints and some variables might not be inspectable on every Line. You might have to play around a bit with the breakpoints to find the spot where the variable is actually loaded into memory and fully available for Visual Studio.